STOCKPILE VOLUME CALCULATION CONTOUR MAP CREATION IN SURFER SOFTWARE
There are many times when we need to calculate the volume of the stockpile, excavated area, or the volume of many areas. There is much software available for this purpose. The Surfer software is one of those. By using the Surfer Software, we can calculate the volume of the stockpile as well as create a contour map of any surveyed area.
A brief description about Surfer Software
Golden Software Surfer is a surface and contour mapping software. It is developed by Golden Software LLC company. You can create high-quality maps by using this Surfer Software. These high-quality maps can be used to explain to colleagues, clients, and many more.
Types of Map created by the Golden Software Surfer
- Contour Map
- Base Map
- Post Map
- 3D Surface Map
- Color Relief Map
- Classed Post Map
- 3D Wireframe Map
- Point Cloud Map
- Drillhole Map
- Peaks and Depressions Map
- 1-Grid Vector Map
- 2-Grid Vector Map
- Watershed Map
- Grid Value Map
- Viewshed Map
STEPS FOR STOCKPILE VOLUME CALCULATION AND CONTOUR MAP CREATING IN SURFER SOFTWARE
STEP 1. First, we need to do a topographical survey of where the stockpile is stored. After the topographical survey, download the survey data from the survey instrument like TS( TOTAL STATION). Arrange the survey data as Easting in 1st column, nothing in 2nd column, and RL or Z value in 3rd column. The arranging sequence is shown below in the image. Follow the instruction written on the image.
STEP 2. Open the Surfer software installed on your system. On the "HOME" menu of the Surfer Software, click "Grid Data" and it will open a pop-up window. There select the excel file in which the survey data are stored by going to the exact folder.
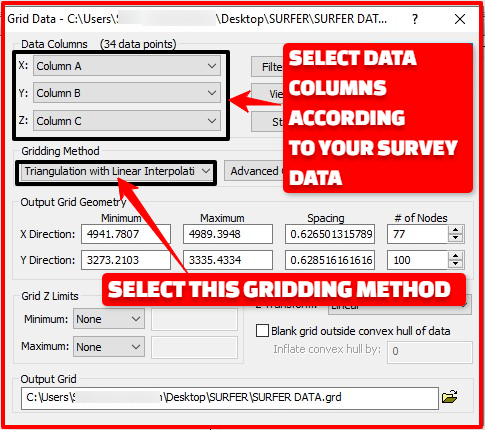
STEP 3. Here in the Data Columns select the appropriate column according to your data in the excel file. Here, XYZ means X=Easting Coordinates, Y=Northing, and Z=Level value. In that Excel file, We have saved Easting in Column A, Northing in Column B, and Level value in Column C. So, in the place of X, Y, and Z, select Column A, Column B, and Column C accordingly. And in the Gridding Method Select-"Triangulation with Linear Interpolation". After that click on the "OK" option.
STEP 4. After clicking on the "OK" option, a notification pop-up window will open. On that notification window, a notification like- "Grid file ...................grd has been created" will be shown. Click on the "OK" option. The grid file will be saved in a folder.
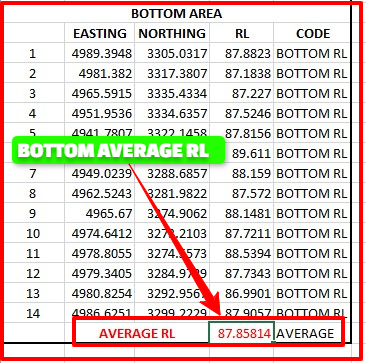
STEP 6. Here, you have selected the upper surface by selecting the grid file. For the lower surface, you need to choose "Constant Z " and write down the bottom average RL there. We need two surfaces (Upper or Top Surface and Lower or Bottom Surface) to calculate the stockpile volume by using the Surfer software. You can add the grid file in the Lower Surface option instead of the Constant Z value.
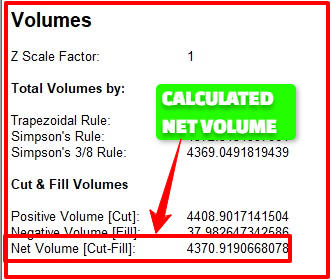
Click on the "OK" option for calculating the stockpile volume.
Here, in this picture, you can see how the average RL has been calculated. Average bottom RL calculated from the survey data of the bottom surface of the said stockpile.
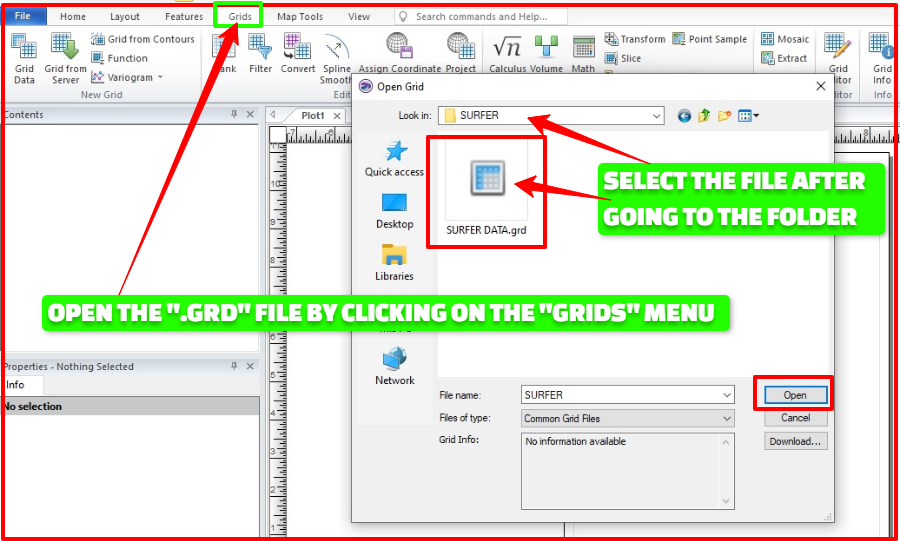
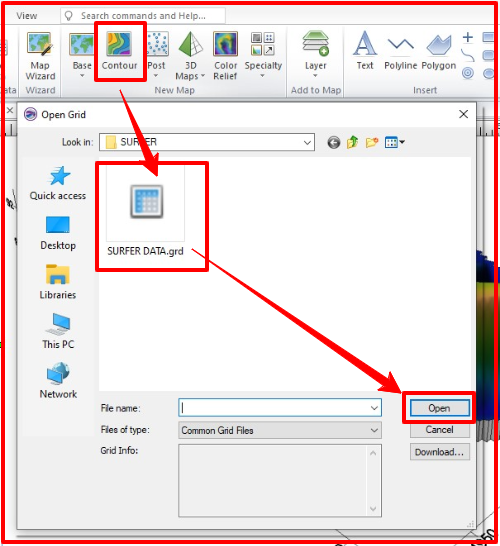
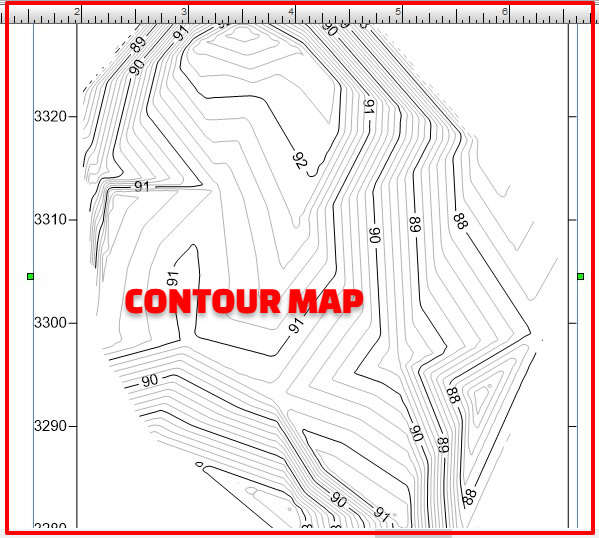
The process of creating a contour map is the same as the process discussed above. You need to create a grid file for both volume calculation and contour map. Here, we have created the grid file. We need to open the grid file in the Surfer software to see the contour map. Go to the "Home" menu, then "Contour" and after that open the grid file.
The contour map will be opened in the surfer software. You can change the contour interval here, major contour interval, edit the contour label. You can export the contour map in AutoCAD. For exporting the contour map to AutoCAD drawing- Click on the "File" option and then click on the "Export". Choose the "DXF AutoCAD DXF Drawing (.dxf) " as export format. The file will be exported in .dxf format. This will be opened in AutoCAD very easily. DXF stands for "Drawing Exchange Format". You can see the contour map in the below image.








0 Comments
Please do not enter any spam link in the comment box